Westlife Foodworld Limited reported a solid performance in its Q4 results 2026, supported by higher restaurant expansion, improving dine-in demand, and strong digital sales growth, even as commodity inflation continued to pressure margins.
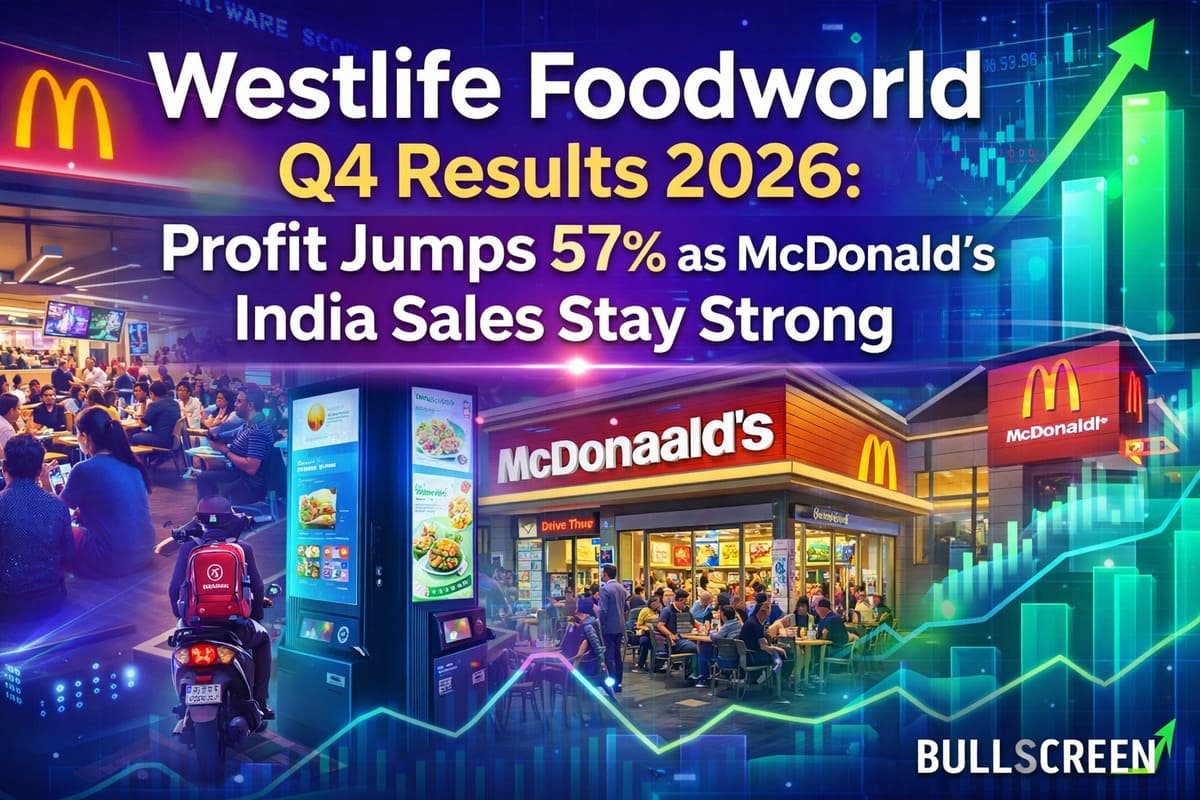
The company posted revenue of ₹655.4 crore in Q4 FY26, up 8.7% year-on-year from ₹603.1 crore in the same quarter last year. Profit after tax rose sharply by 56.6% to ₹23.8 crore, while operating EBITDA increased 9.6% to ₹86.9 crore during the quarter.
Westlife Foodworld added 21 new restaurants in the quarter, taking its total store network to 478 restaurants across 78 cities. The company plans to open more than 60 new outlets in FY27 as part of its long-term expansion strategy.
Digital channels remained a major growth driver in the Q4 results 2026, with digital sales contributing 76% of total revenue. The company’s mobile app ecosystem also expanded significantly, with app downloads reaching nearly 52 million and monthly active users standing at around 3.5 million.
Restaurant operating margin improved to 19.8% in Q4 FY26 from 19.1% a year ago, helped by supply chain efficiencies and tighter cost controls. However, gross margin narrowed to 68.1% due to rising cocoa and coffee prices.
Same-store sales growth turned positive at 1.5% in Q4 FY26 after a weak previous quarter, driven by value meal offerings and higher customer traffic. On-premise sales, including dine-in and takeaway, accounted for 58% of quarterly sales and grew 9% year-on-year.
The company said demand momentum in West India remained healthy, while southern markets showed early recovery signs. Management also highlighted continued focus on drive-thru expansion, omnichannel growth, and value-driven menu innovation under its Vision 2027 roadmap.
| Metric | Q4 FY26 | Q4 FY25 | YoY Change |
|---|---|---|---|
| Revenue | ₹655.4 Cr | ₹603.1 Cr | ↑ 8.7% |
| Profit After Tax (PAT) | ₹23.8 Cr | ₹15.2 Cr | ↑ 56.6% |
| Operating EBITDA | ₹86.9 Cr | ₹79.4 Cr | ↑ 9.6% |
| Restaurant Operating Margin | 19.8% | 19.1% | ↑ 70 bps |
| Same-Store Sales Growth | 1.5% | Negative Trend | Recovery |
| Gross Margin | 68.1% | 70.0% | ↓ Due to inflation |
| Metric | FY26 Performance |
|---|---|
| Total Restaurants | 478 Stores |
| Cities Presence | 78 Cities |
| New Restaurants Added in Q4 | 21 Stores |
| Planned Openings in FY27 | 60+ Stores |
| Digital Sales Contribution | 76% of Revenue |
| Mobile App Downloads | 52 Million |
| Monthly Active Users (MAU) | 3.5 Million |
| Drive-Thru Share of Network | 25% |
| Metric | Key Insights |
|---|---|
| On-Premise Sales Growth | ↑ 9% YoY |
| Off-Premise Sales Growth | ↑ 6% YoY |
| Key Growth Driver | McDelivery & Digital Orders |
| Popular Strategy | McSaver ₹99 Meals |
| Major Cost Pressure | Cocoa & Coffee Inflation |
| Strong Market Performance | West India |
| Recovery Signs | South India Markets |
| Vision 2027 Focus | Expansion, Digital Growth & Cost Efficiency |
Source: https://www.bseindia.com/xml-data/corpfiling/AttachHis/ff77e20c-fa7c-432f-9a42-bddb6248e416.pdf