DCW Limited reported a sharp improvement in earnings in its Q4 results 2026 and full-year FY26 performance, supported by strong demand in specialty chemicals, lower finance costs, and continued debt reduction.
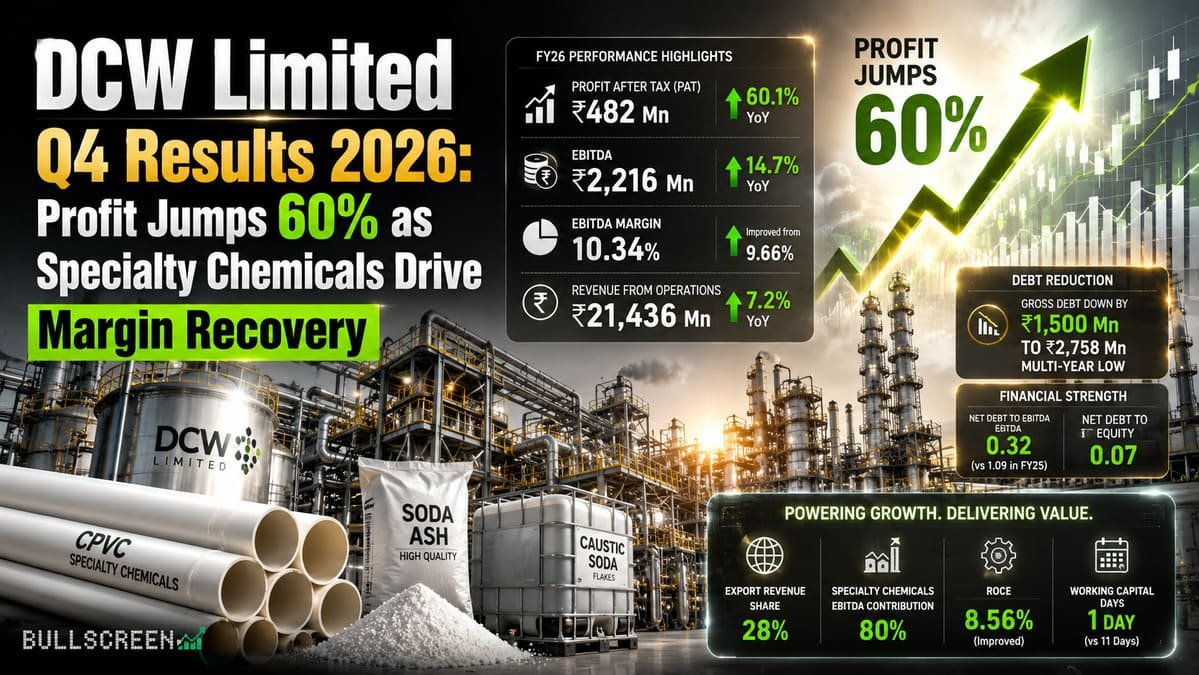
The company posted revenue from operations of INR 21,436 million for FY26, marking a 7.2% year-on-year increase despite some PVC production being diverted for captive consumption. EBITDA rose 14.7% YoY to INR 2,216 million, while EBITDA margins improved to 10.34% from 9.66% a year earlier.
Profit after tax surged 60.1% YoY to INR 482 million, making the latest Q4 results 2026 one of the company’s strongest earnings recoveries in recent years. Diluted EPS climbed nearly 60% to INR 1.63.
A major highlight of the Q4 results 2026 was the company’s continued deleveraging. Gross debt declined by INR 1,500 million to INR 2,758 million, bringing net debt-to-EBITDA down sharply to 0.32 from 1.09 in FY25. Net debt-to-equity stood at just 0.07, reflecting a stronger balance sheet.
DCW’s specialty chemicals business, including CPVC and SIOP, remained the key earnings driver. The segment contributed 28% of total revenue but accounted for nearly 80% of EBITDA. The company also completed its Phase III CPVC expansion, raising capacity from 40,000 TPA to 50,000 TPA by March 2026.
Operational efficiency remained strong, with SIOP utilization at 102% and soda ash utilization at 91%. Export revenue contributed 28% of total sales, while ROCE improved to 8.56%.
As of March 31, 2026, DCW Limited had a market capitalization of INR 11,086.02 million, with promoter shareholding at 45.44% and foreign portfolio investors holding 6.71%.
| Metric | Performance | YoY Change / Status |
|---|---|---|
| Revenue from Operations | INR 21,436 Mn | ▲ 7.2% |
| EBITDA | INR 2,216 Mn | ▲ 14.7% |
| EBITDA Margin | 10.34% | Improved from 9.66% |
| Profit After Tax (PAT) | INR 482 Mn | ▲ 60.1% |
| Diluted EPS | INR 1.63 | ▲ 59.8% |
| Gross Debt | INR 2,758 Mn | Reduced by INR 1,500 Mn |
| Metric | Key Data |
|---|---|
| Specialty Chemicals Revenue Contribution | 28% |
| Specialty Chemicals EBITDA Contribution | 80% |
| Basic Chemicals Revenue Contribution | 71% |
| CPVC Capacity Expansion | 40,000 TPA → 50,000 TPA |
| SIOP Capacity Utilization | 102% |
| Soda Ash Capacity Utilization | 91% |
| Export Revenue Share | 28% of total revenue |
| Captive Power Plant | 58 MW |
| Metric | FY26 Status |
|---|---|
| Net Debt to Equity | 0.07 |
| Net Debt to EBITDA | 0.32 |
| ROCE | 8.56% |
| Working Capital Days | 1 Day |
| Market Capitalization | INR 11,086.02 Mn |
| Current Market Price (CMP) | INR 37.56 |
| Promoter Holding | 45.44% |
| FPI Holding | 6.71% |
Source: https://www.bseindia.com/xml-data/corpfiling/AttachHis/856f496f-da79-4748-a79d-54b29894b2f3.pdf