Aavas Financiers Limited reported a steady performance in its Q4 results 2026, capping a year marked by balance sheet expansion, improved margins, and stable asset quality. The housing finance company crossed key milestones, including a ₹200 billion balance sheet and net worth above ₹50 billion.
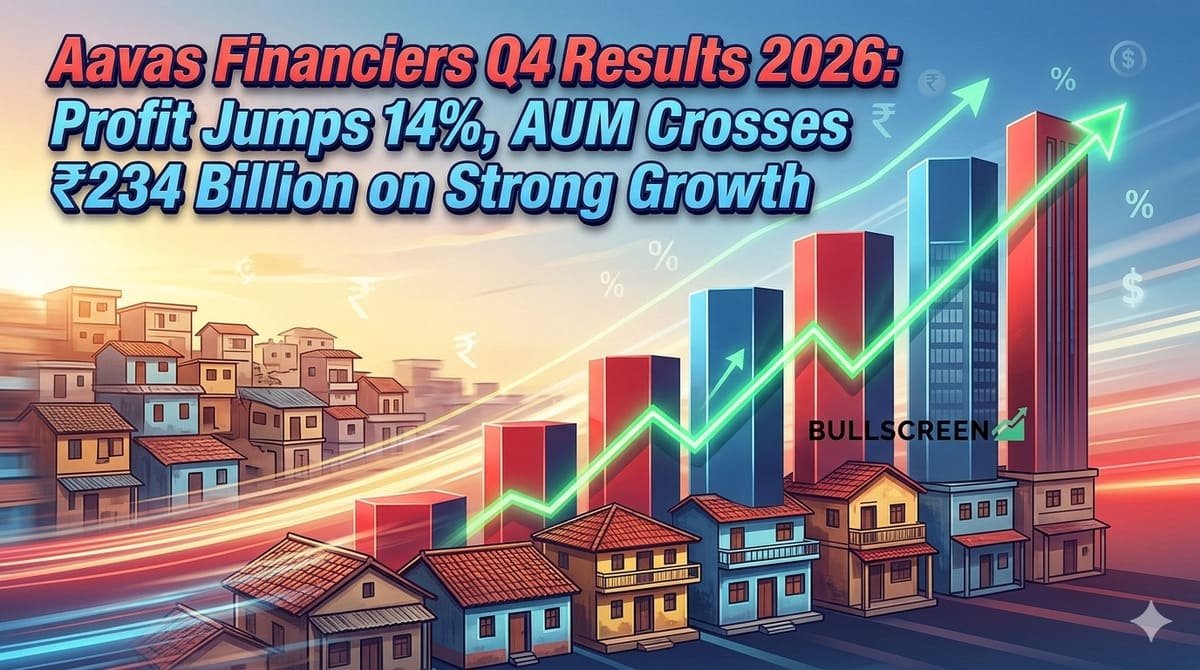
For FY26, Profit After Tax (PAT) rose 14% year-on-year to ₹6,556 million, supported by strong growth in lending and improved operational efficiency. Assets Under Management (AUM) increased 15% to ₹234.5 billion, while total disbursements climbed 11% to ₹67.8 billion, reflecting sustained demand in the affordable housing segment.
The company’s Net Interest Margin (NIM) expanded to 7.93%, up 29 basis points, with spreads improving to 5.20%. Return ratios remained healthy, with Return on Assets (ROA) at 3.29% and Return on Equity (ROE) at 13.93%. Interest income grew 14.7% to ₹23,409.4 million, while interest expenses rose at a slower pace of 8.8%, supporting margin expansion.
Operating expenses increased 21% year-on-year to ₹7,055.4 million, indicating continued investment in growth and digital capabilities. Net worth stood at ₹50,508.5 million, up 16%, while borrowings rose 12.7% to ₹156,855.7 million.
Asset quality showed further improvement in the Q4 results 2026. Gross Non-Performing Assets (GNPA) declined to 1.05%, while Net NPA stood at 0.68%. The 1+ Day Past Due (DPD) metric improved to 3.17%, and credit costs remained contained at 17 basis points.
Operationally, Aavas continued to expand its footprint, serving over 405,000 families through 270,852 active loan accounts. The company operates 435 branches across 15 states and Union Territories, with a recent entry into Tamil Nadu. Housing loans account for 65% of AUM, while non-housing loans contribute 35%.
Strategically, the company onboarded CVC Capital Partners as its new promoter and advanced its digital transformation through the Aavas 3.0 initiative, integrating platforms like Salesforce and Oracle Flexcube. It also secured funding commitments of ₹9.8 billion from the Asian Development Bank and ₹5.0 billion via PTC securities.
The Q4 results 2026 reflect Aavas Financiers’ focus on scalable growth, strong risk management, and deeper penetration in underserved markets, positioning it well for sustained expansion.
| Metric | FY26 | YoY Growth |
|---|---|---|
| Profit After Tax (PAT) | ₹6,556 Mn | +14% |
| Assets Under Management (AUM) | ₹234.5 Bn | +15% |
| Disbursements | ₹67.8 Bn | +11% |
| Net Interest Margin (NIM) | 7.93% | +29 bps |
| Spread | 5.20% | Improved |
| Return on Assets (ROA) | 3.29% | Stable |
| Return on Equity (ROE) | 13.93% | Stable |
| Net Worth | ₹50,508.5 Mn | +16% |
| Metric | FY26 | FY25 | YoY Change |
|---|---|---|---|
| Interest Income | ₹23,409.4 Mn | ₹20,410.3 Mn | +14.7% |
| Interest Expense | ₹11,051.3 Mn | ₹10,157.9 Mn | +8.8% |
| NIM (Absolute) | ₹15,797.0 Mn | ₹13,426.2 Mn | +17.7% |
| Operating Expenses | ₹7,055.4 Mn | ₹5,829.1 Mn | +21.0% |
| Borrowings | ₹156,855.7 Mn | ₹139,184.8 Mn | +12.7% |
| Category | Metric | FY26 |
|---|---|---|
| Asset Quality | GNPA | 1.05% |
| Asset Quality | NNPA | 0.68% |
| Risk Indicator | 1+ DPD | 3.17% |
| Credit Cost | FY26 | 17 bps |
| Customer Base | Total Families Served | 405,000+ |
| Loan Accounts | Active Accounts | 270,852 |
| Branch Network | Total Branches | 435 |
| Geographic Presence | States/UTs | 15 |
| Avg Ticket Size | Per Loan | ₹1.0 Mn |
| Loan-to-Value (LTV) | Average | 55.4% |
| Portfolio Mix | Housing Loans | 65% |
| Portfolio Mix | Non-Housing Loans | 35% |
Source: https://www.bseindia.com/xml-data/corpfiling/AttachLive/83af40cf-e12c-433f-8858-abb9be2eb779.pdf